of My Google Ads?")


Love it or hate it, PowerPoint is ubiquitous when it comes to formal presentations. Perhaps you are pitching a new proposal. Or, perhaps you’ve spent weeks number-crunching or conducting intensive research and it’s time to communicate your findings to the relevant stakeholders. Whatever your purpose, PowerPoint is arguably one of the most important components to your success.
When I was a management consultant I lived in Microsoft Excel and PowerPoint, toggling between the two programs every day. I loved that PowerPoint’s flexibility allowed me to illuminate and transform data into a story—a story of financials, an industry’s growth trajectory, or recommendations for restructuring a business process. However, especially as I was just starting out, this flexibility often proved to be a double-edged sword. It was frustrating how tedious slide design could be, and how long it took to aesthetically perfect a slide. I often found myself making a decision between spending copious amounts of time on PowerPoint slides, or creating a basic, minimalist deck that risked sacrificing the effectiveness of the data and the message. It wasn’t until I mastered PowerPoint tips, that I no longer experienced this dilemma.
This article showcases a selection of advanced PowerPoint presentation tips and tricks, which will enable you to become quicker at using the tool. It will hopefully also prevent you from sacrificing effective messaging in an effort to save time. While many PowerPoint articles provide qualitative advice around effectively delivering a message, this piece focuses on the technical components of PowerPoint and presentation design. It utilizes functionalities and commands in Microsoft Office PowerPoint 2016 for PC. Let’s get started.
Customizing the Quick Access Toolbar
The first step to becoming a PowerPoint expert is building your Quick Access Toolbar. It’s a customizable toolbar sitting above the ribbon, where you can add your favorite and most frequently-used commands. Invest five minutes to set it up, and you won’t regret it—it’ll pay out in dividends each time you use PowerPoint thereafter. Here’s a quick lay of the land before we delve into the logistics:
Exhibit 1: Components of your PowerPoint Home Screen
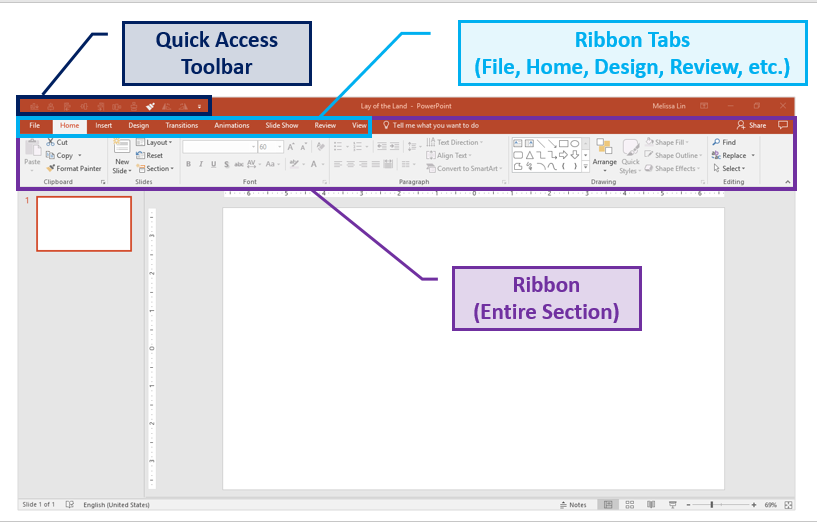
To customize your toolbar’s functionality and ordering according to your preference, simply click the white downwards-facing arrow above your ribbon to customize your toolbar. Then click “More Commands” → Choose Commands from “All Commands” → Select and add your favorite commands. If you want to remove any commands, simply select the command and hit “Remove.”
Exhibit 2: Building the Ultimate Quick Access Toolbar
Below are my “must-haves” for the ultimate quick access toolbar (QAT):
Align: The alignment tool is hands-down my favorite tool in PowerPoint. Bypass the futile, manual effort and instead highlight the shapes you want to align, and choose which direction to align them. You can align objects to the middle, right, left, top, and bottom of each other. Keep in mind that the positions of the objects are all relative to each other.
Exhibit 3: How to Use the Align Function
If you want to use this tool outside of your QAT: Highlight your desired objects → “Format” tab in the ribbon → Click “Align” → Select your preferred alignment direction → The objects will be aligned
Distribute: If you have multiple objects or shapes that you want to make equidistant from each other, this tool will be your new best friend. Before distributing objects, it’s best to first align them. Then, to distribute, simply highlight the objects you want to distribute, and select “distribute horizontally” or “distribute vertically.”
Exhibit 4: How to Use the Distribute Function
If you want to use this tool outside of your QAT: Highlight your desired objects → “Format” tab in the ribbon → Click “Align” → Select “Distribute Horizontally” or “Distribute Vertically” → The objects will be distributed
Format painter: Allows you to copy the formatting from one object and apply it to another one. It is essentially copying and pasting, but for formatting and not content.
- One click on format painter: Applies the formatting from the original object to the next object you select/click on.
- Two clicks on format painter: Locks in the format painter. After double-clicking, any object you select will convert to the formatting of the first object. To unlock format painter, click on any white-space on the slide (not an object).
If you want to use this tool outside of your QAT: Select the object you want to mimic → Click “Format Painter” once or twice in the “Home” tab in the ribbon → Click on the object you want to change → The formatting changes will be applied
Rotate: As the name implies, this feature enables you to rotate objects, in increments of 90 or 180 degrees. You can rotate a text box, shape, WordArt, or picture. This includes rotations to the right 90 degrees, to the left 90 degrees, vertically, and horizontally.
If you want to use this tool outside of your QAT: Highlight your desired object(s) → “Format” tab in the ribbon → Click “Rotate” → Select your preferred rotation option → The objects will be rotated
Life-Changing PowerPoint Keyboard Shortcuts
You might think I’m exaggerating, but once you realize you don’t have to manually perform these actions, you won’t look back. Generally, utilizing PowerPoint does not require memorizing as many hot keys as Excel does, but there are a few that you should be aware of.
Easily change the order and indent-level of bulleted text in text boxes:
- Change the order of bulleted text in text boxes: ALT + SHIFT + Up/Down Arrow Key
- Change the indent-level of bulleted text in text boxes: ALT + SHIFT + Right/Left Arrow Key
Resize an object while keeping them regular and in proportion:
- Hold SHIFT while you’re resizing an object with your pointer/mouse
Micro-nudges (small nudges for your objects):
- Select the object and hold CTRL + Up/Down/Right/Left Arrow Key to move it
Duplicate your shape or object without copy & paste:
- CTRL + Drag the shape with your pointer/mouse
Ensure that your lines are actually straight:
- For vertical lines: Insert the shape → Right click → Format Shape → Size & Properties → Set “Height” to “0” → Perfectly straight line
- For horizontal lines: Insert the shape → Right click → Format Shape → Size & Properties → Set “Width” to “0” → Perfectly straight line
Transform a number into a footnote superscript:
- Type in the number of the footnote (e.g., 1, 2, 3) → Highlight the number → Hold CTRL + SHIFT + the equal sign (=) → Your number will now be a footnote superscript
Adjust the case of your text by toggling between text cases (lowercase, title case and all caps):
- Highlight the desired words and use the SHIFT + F3 shortcut. Each time you hit F3, the highlighted text will change to all lowercase, all caps, or title style where only the first letter of a word is capitalized.
PowerPoint Design Tips for These Common, Frustrating Situations
If you’ve worked in PowerPoint consistently, you’ve likely encountered the following conundrums. Instead of spending an unnecessary 15-30 minutes Googling the issue for a workaround, here’s how to navigate the situation every time:
How to convert text to SmartArt
Example Situation: I’ve got a list of boring bullets and I need inspiration to make them more polished.
Solution: Leverage the “Convert to SmartArt” tool. Select the text box with the bullets → Under “Home” in the ribbon, Select “Convert to SmartArt” → Hover over different SmartArt options to see your bullets transformed → Select whichever SmartArt strikes your fancy, and continue to edit from there
Exhibit 5: Use SmartArt to Give Life to Boring Bullets
How to Resize Multiple Objects/Shapes at Once
Example Situation: I used multiple shapes/images in the slide and I want to change their collective size without messing up the proportions.
Solution:
- First, group all the objects together. To group, highlight all objects and either right click → Group, or highlight and hit ALT + G.
- Then, adjust the size with your mouse while holding SHIFT to keep the proportion. This will help you resize and fit multiple objects without distorting the original proportions and shapes.
Exhibit 6: Grouping is Key for Resizing and Proportions
How to Identify and Match Exact Colors
Example Situation: You need to utilize a specific, custom color but you can’t seem to find it in the color palette.
Solution: The eyedropper tool quickly identifies the exact color you are looking to match, and applies it to the text or object you are trying to change. While format painter can be helpful for applying the exact same formatting (size, coloring, etc.) from one object to another, sometimes you might only be looking to apply the same color. In these cases, the eyedropper tool is very helpful.
A common use case for this tool is for pitch decks. If you are looking to match the theme of the deck to the potential client/partner’s logo, the eyedropper tool can prove invaluable.
- Select the text box you want to change → Click on the coloring format → Select the eyedropper tool → Using the eyedropper tool, hover over the color you want to mimic → When the color’s identification appears, click the color you want
Exhibit 7: Don’t Get Caught Using an Off-Brand Shade
How to Leverage Arrows with Elbow Connectors
Example Situation: I’m trying to draw arrows from one shape to another, but the arrows are crooked and look unprofessional.
Solution: Use the arrows with an elbow connector (90 degree angles). They automatically snap to the center of an object, and can be formatted in different colors and sizes. These are especially helpful when building organizational charts.
- Go to the Insert ribbon → Insert a shape → Under the “Lines” category, select the arrows with elbow connectors → Once selected, use the arrow to connect the center of one shape to the center of another shape → Repeat until completion
Exhibit 8: Use Arrows with Elbow Connectors to Build Organizational Charts
How to Fit Text Into a Shape
Example Situation: I’m typing a text label into a shape, but the text doesn’t fit and breaks the word into two lines.
Solution: There are two ways to go about it:
- Option 1: Right click the shape → “format the shape” → Change the text margins to “0” from the left, and “0” from the right. Nine times out of ten, this will solve your issue.
- Option 2: Forget about dealing with the original shape. Instead, insert a text box over the original shape (text box should use a transparent background) and type directly into the text box. The text will show up over the shape, but nobody will know it was a manual workaround.
-
How to Remove the Background of a Picture
Example Situation: I used an image from the web in a slide and I want to change the background image color but can’t figure out how to do it.
Solution: This technique is most effective when used on images with high contrast.
- First, you must remove the original background color of the image. Click on the image you want to change → Select the “Format” tab in the ribbon → Click “Remove Background” → Fix any portions that were not perfectly removed → Click outside the image when you’re ready
- Next, you will want to add in the new background color of the image. As you can see, the perfect execution of this does require a steady hand (that I clearly do not quite have). Still, it’s a helpful trick to have in your back pocket.
Exhibit 9: Weird Background Color in Your Photo? Here’s How to Fix It.
How to Convert a Table to Text Boxes
Example Situation: You want to convert a datatable into different formatting on another slide, but you don’t want to manually type the numbers in and risk a mistake.
Solution: Break your table into multiple text boxes and objects, which saves you the trouble of retyping the data and will be easier to manipulate
- Copy the entire table → Paste special (paste as picture enhanced metafile) → Ungroup it → Answer “yes” to the dialog box → Ungroup it again → Answer “yes” again.
- Voila, now your table has been broken into text boxes and shapes. You can now copy and paste the data you need into another slide and re-format as you like.
Exhibit 10: Break Your Datatable Into Individual Objects to Avoid Embarrassing Typos
How to Make a Table’s Rows or Columns the Same Size
Example Situation: You’ve created and filled a table with data, but the size of some rows or columns do not match the others. Your OCD starts to kick in but you can’t figure out how to get them to match perfectly.
Solution: Use the “Distribute Rows” and “Distribute Columns” tools.
- Select the entire data table → “Layout” tab in the Ribbon → Click “Distribute Rows” and “Distribute columns.”
Exhibit 11: Use This Foolproof Method to Ensure Polished, Professional Tables
Other PowerPoint Features and Best Practices
Create custom deck templates using Slide Master, which can be found under the “View” tab in the ribbon. Slide Master allows you to quickly modify the slide design in your presentation. You can either customize the slide master, which will affect every slide in the presentation, or you can modify individual slide layouts, which will change any slides using those layouts.
Rely less on your eyesight when moving objects around with the Guides or Gridlines view. First, you should adjust your settings to utilize the “Snap-to-Grid” function. Here’s how to do so: “View” tab → Click on the “Grid Settings” next to the word “Show” → Enable “Snap objects to grid. If you’d like to view the actual guides or gridlines, you can select these options under the “View” tab in the ribbon; they can easily be turned on and off. Please note that you can move guides around, while gridlines are set.
Exhibit 12: Guides and Gridlines Are Helpful References for Object Positioning
Link a chart from your Excel workbook to your PowerPoint presentation to enable dynamic updating of numbers.
- When your chart is ready in Excel, copy the chart → Toggle to PowerPoint → In the “Home” tab in the ribbon, click “Paste” → Select “Paste Special” → Select “Paste Link” and “Microsoft Excel Chart Object” → Now when you update the numbers in Excel, the chart in PowerPoint will update dynamically. This feature works best when both programs are open in tandem.
- If you close the Excel document and then update the figures in the table, remember to go back to your PowerPoint chart, right click the chart, and select “Update link” to ensure that the data refreshed.
Exhibit 13: Skip the Cross-Checking Between Excel and PowerPoint
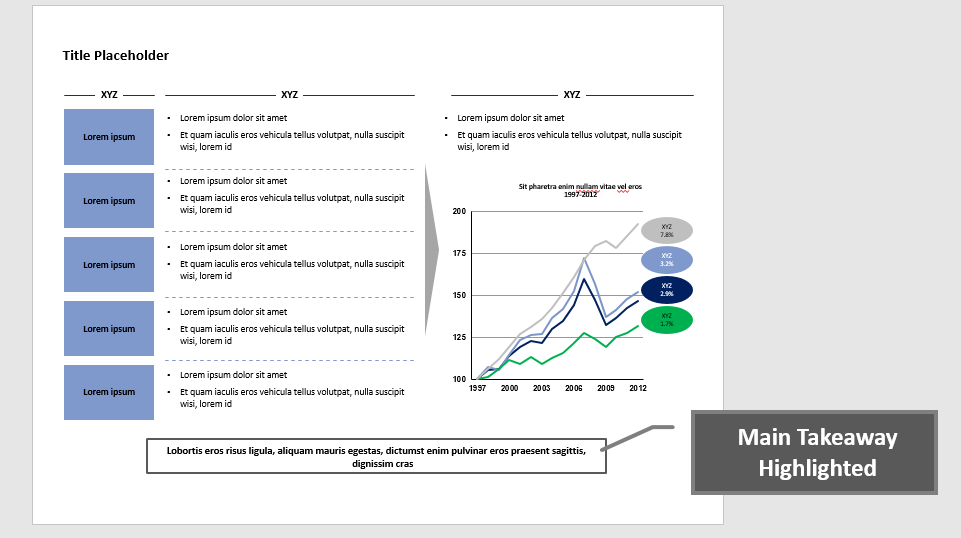
On busy slides crowded with data, visually highlight your main takeaway at the bottom. A rectangular box (as shown below) is common.
Exhibit 14: Help the Audience Navigate Complexity by Driving Your Point Home
Remember to include keys with your graphs and charts to help orient your audience.
Slide Templates and Presentation Graphics for Common Concepts
Have you ever felt déjà vu when designing a new PowerPoint deck? It’s probably because we often create new slides to convey similar concepts, even if the content is different—be it a process, progress, or an organizational chart. At the end of the day, it makes sense to reuse a slide structure even if the actual content refreshes. To communicate these common concepts, many of the largest consulting firms repeatedly utilize the following slide components:
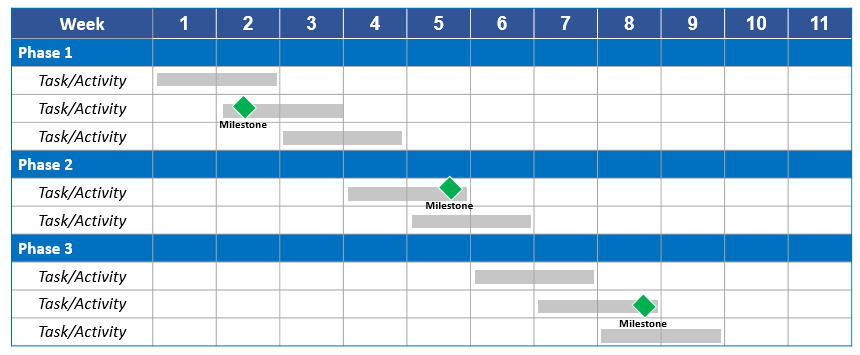
Project Schedule: Gantt Chart
Exhibit 15: Sample Gantt Chart
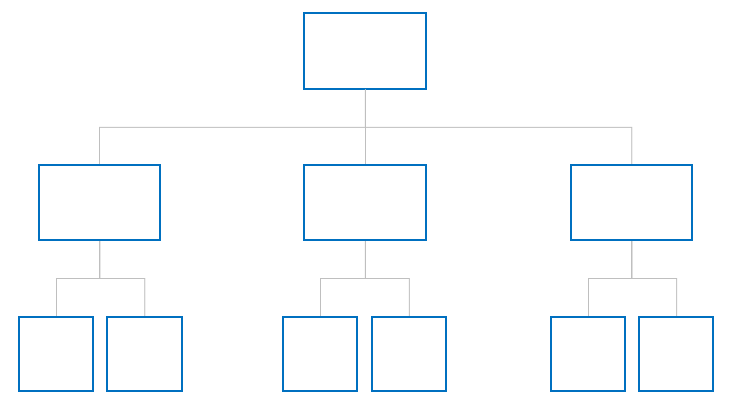
Organizational Structure: Organizational chart
Exhibit 16: Sample Organizational Chart
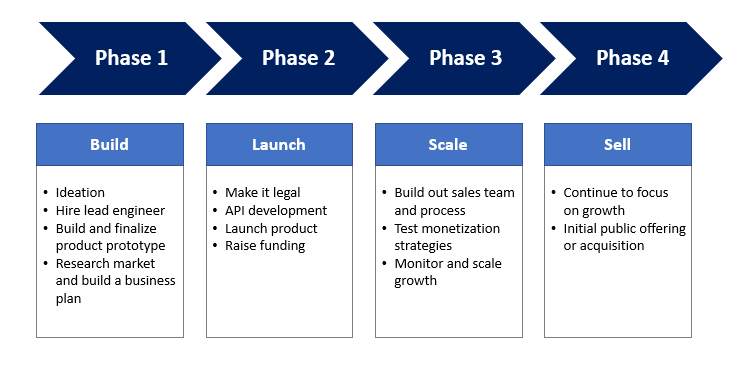
Process: Arrows leading into one another
Exhibit 17: Sample Process Flow Chart
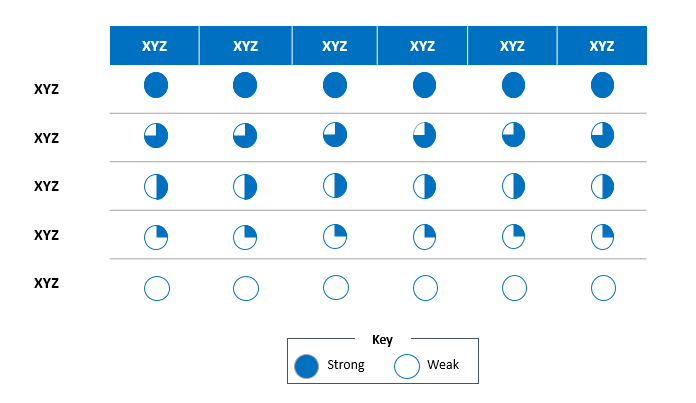
Indicating the degree to which a particular item meets a criterion: Harvey Balls
Exhibit 18: Sample Harvey Balls Display
Hierarchy of items: Pyramid
Exhibit 19: Sample Pyramid Chart

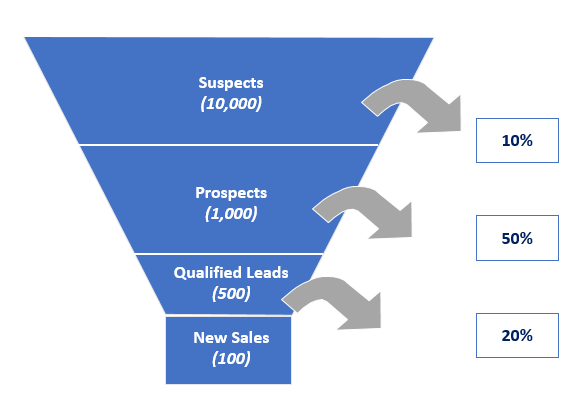
Journey through a channel: Funnel
Exhibit 20: Sample Sales Funnel
Sample PowerPoint Presentations and Final Thoughts
If you’re interested in previewing some top consulting firm client deliverables, feel free to browse 30 McKinsey presentations and a mix of Mckinsey, Boston Consulting Group and The Parthenon Group decks.
Designing PowerPoint presentations does not have to be painful. It’s important to remember that with PowerPoint, the devil is in the details. Once you become more familiar with the tool’s nuances and are aware of available workarounds, you will find yourself spending less time with the manual build. So, what are your favorite PowerPoint tips and tricks?
This post originally appeared on Toptal Finance