of My Google Ads?")


Key Highlights
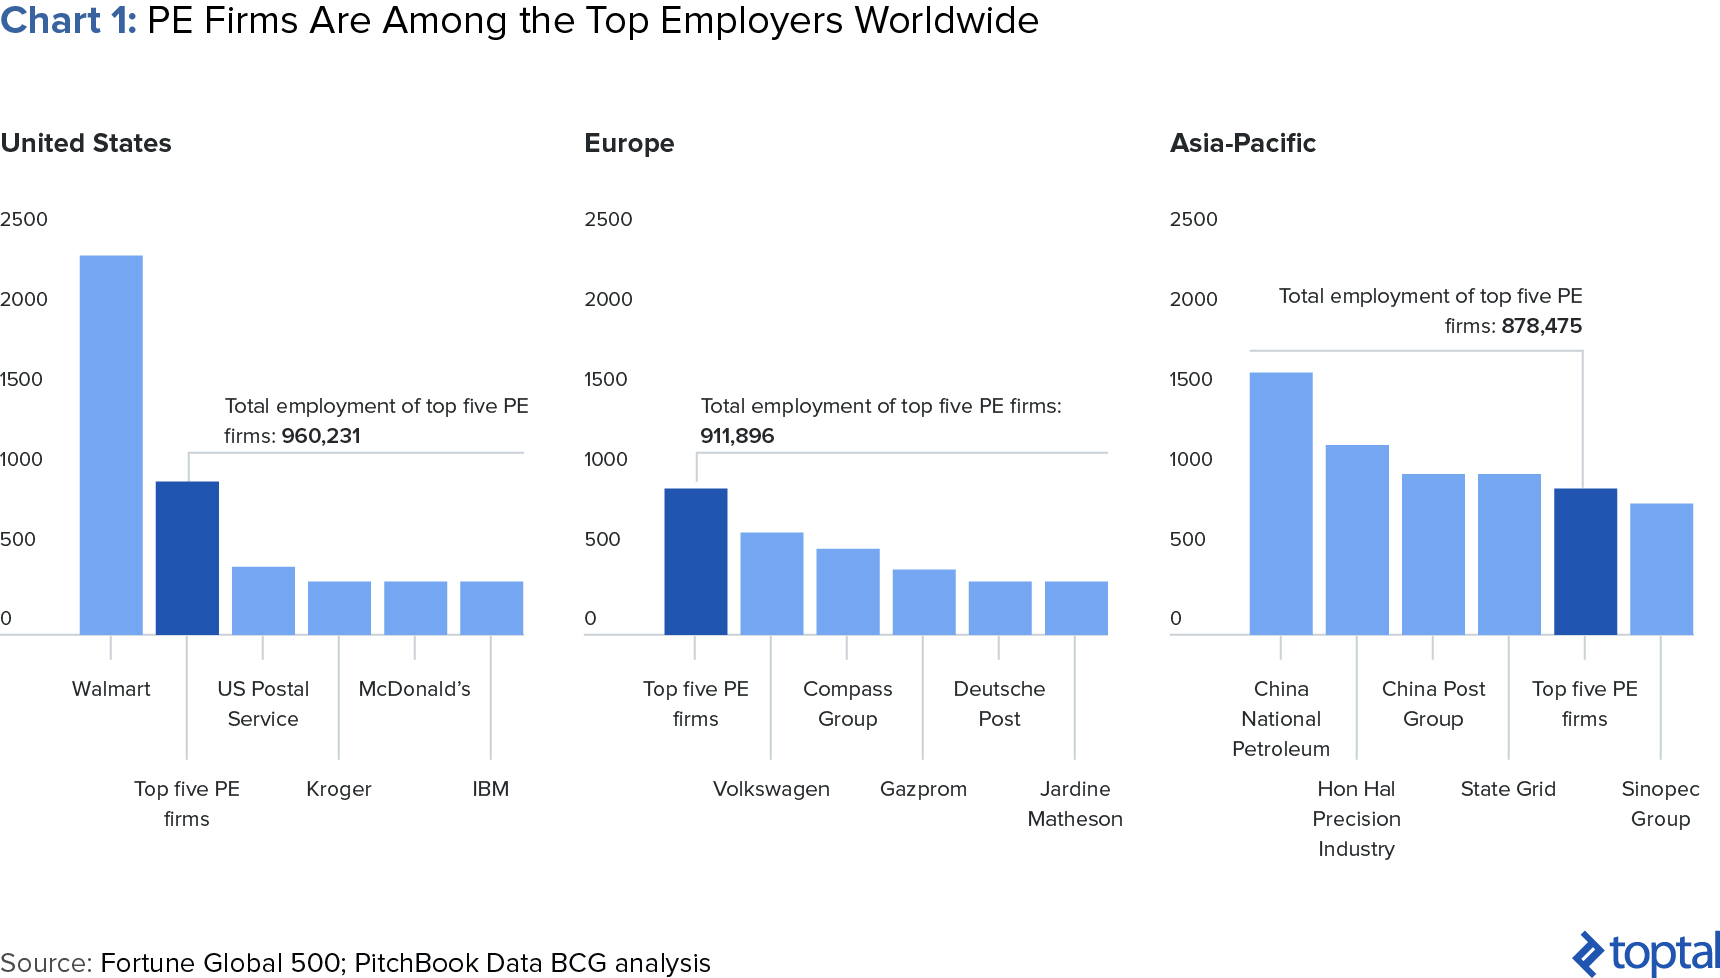
- From its origins in the 1970s, buyout private equity has grown into one of the most well-known and now one of the largest asset classes within the private capital space. In the US, if one aggregates the top five PE funds by number of people employed, they would rank second only after Walmart.
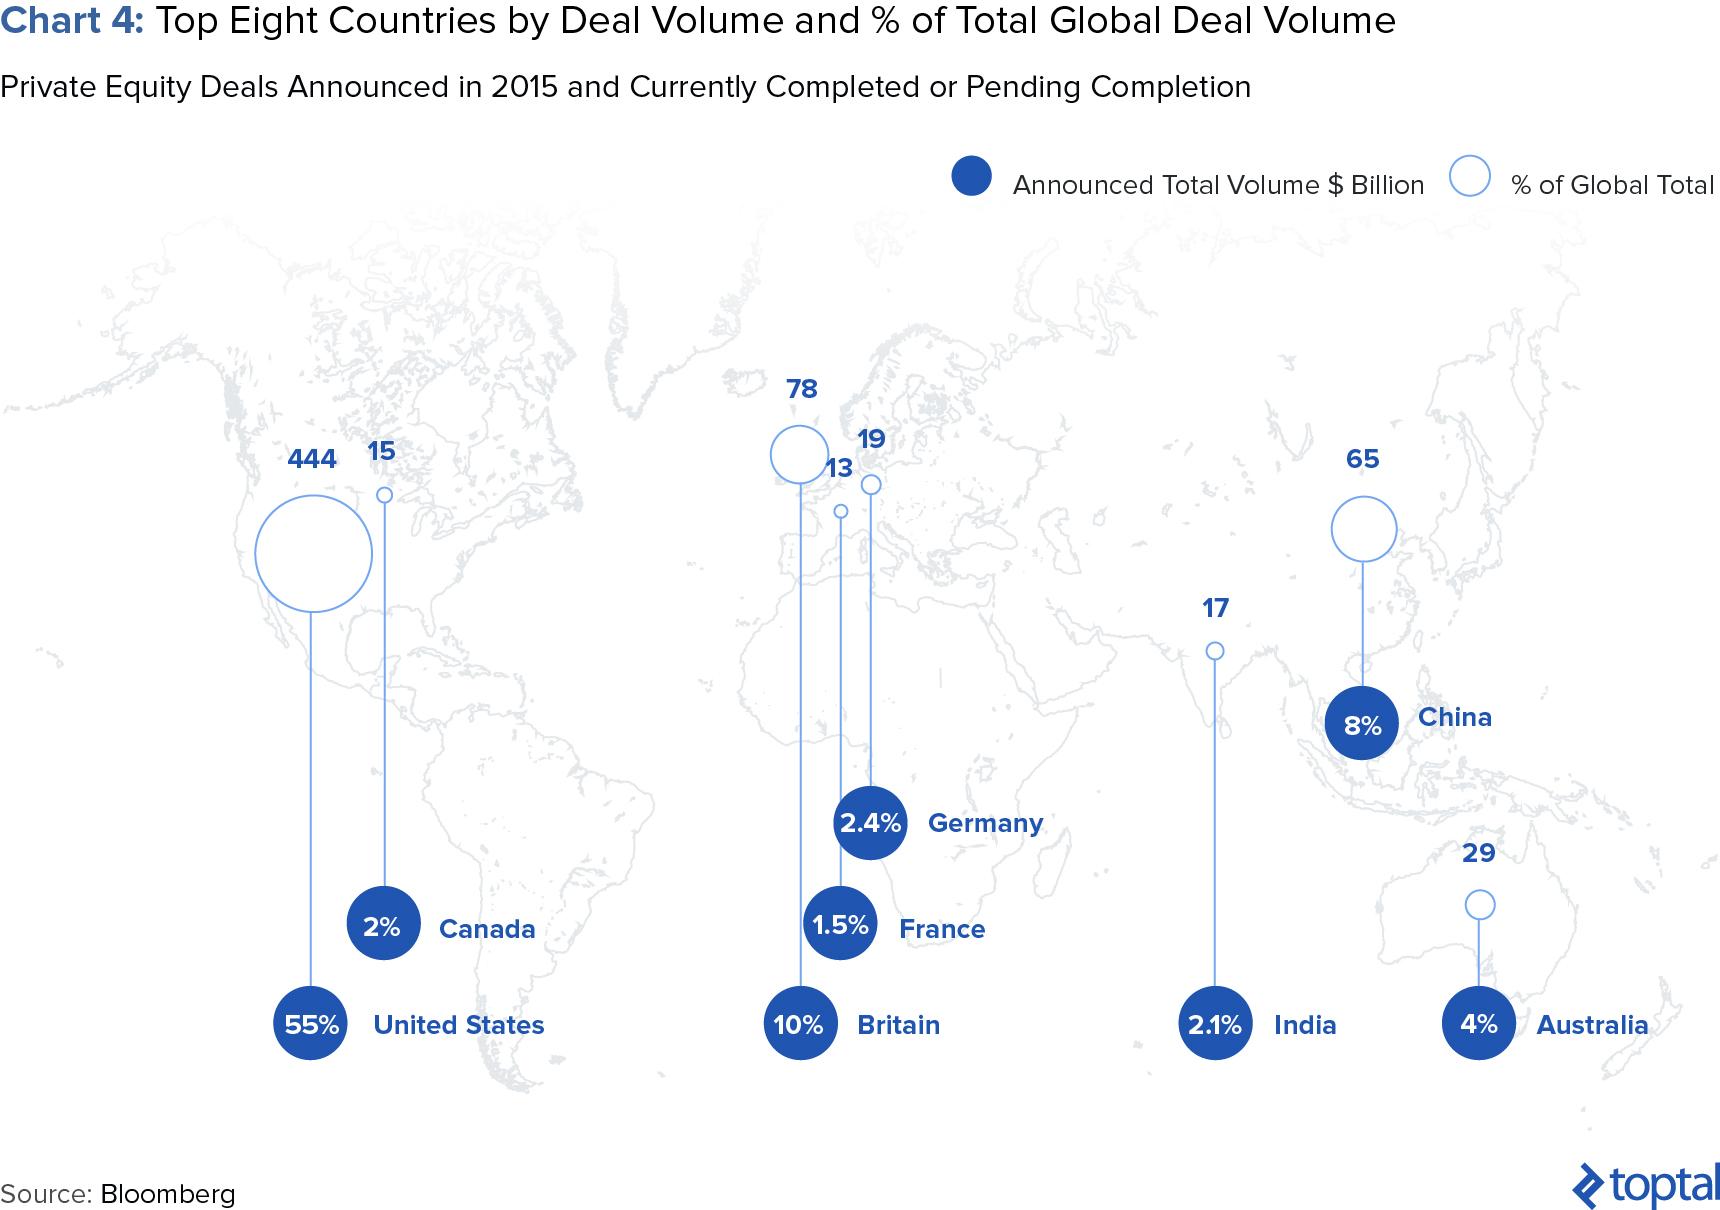
- The North American private equity market is by far the largest in terms of value, accounting for over 57% of global deal value in 2015. The second most active area in the world in terms of value of deals was Europe, with China increasingly becoming a PE superpower.
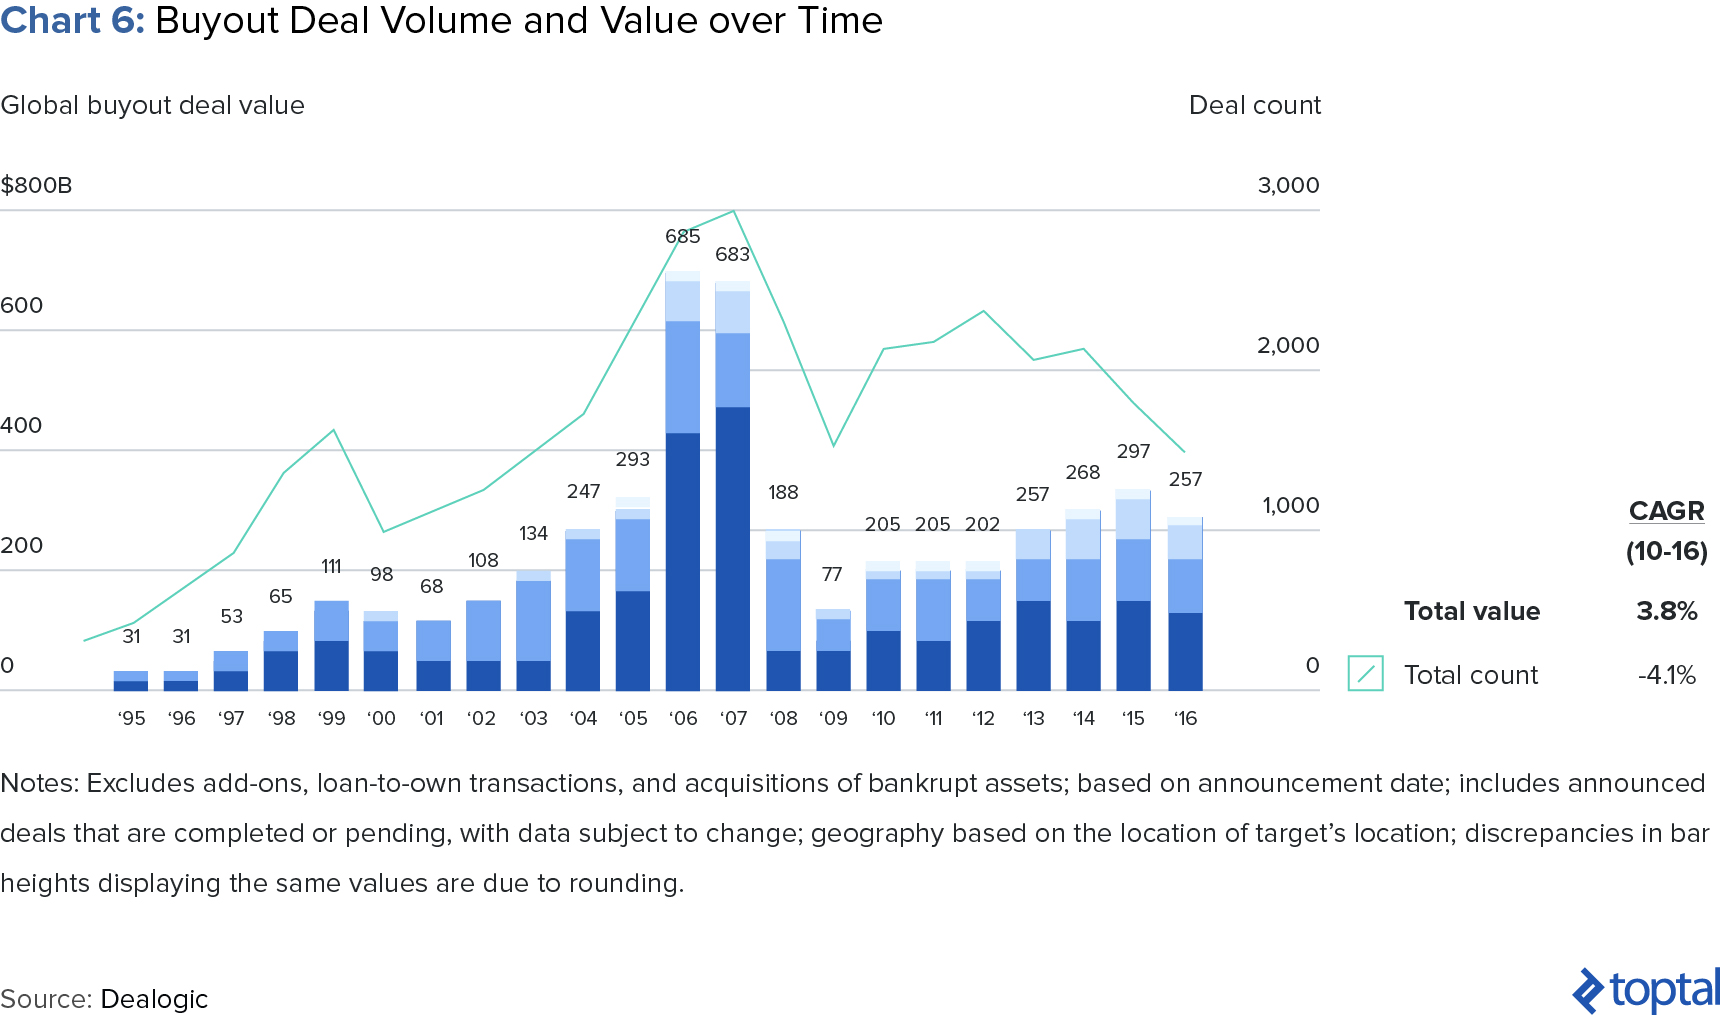
- The private equity industry is likely entering a phase of maturity. After more than three decades of strong growth, in which global deal volumes ballooned from the $30 billion range in the mid-1990s to nearly $700 billion in 2006/2007, the industry is showing classic symptoms of entering a “maturity phase.”
- At no point in history has the private equity space been as competitive as it is today. Between the years 2000 and 2016, the number of private equity firms globally has tripled and the amount of assets under management (AUM) has grown from almost $600 billion in 2000 to almost $2,500 billion.
- Increased competition from cash-rich corporates. This is resulting in increased numbers of auctions with corporates who, as we describe, are in many cases able to absorb higher valuations. As a result, in 2016 buyout firms’ global share of all M&A deals dropped to 4.2%, the lowest level since the 2009 recession minimums
- The above effects are creating market conditions which are unfavorable for the asset class. The excess of demand for deals has pushed valuations to highs only seen in the pre-recession years: a median purchase price of 9.2 times EBITDA globally, and 10.9 times EBITDA in the U.S., making it ever more challenging for PE funds to find attractive deals.
- Returns for the asset class have also already begun to suffer. Median net internal rates of return, have been largely stagnant since the beginning of the century at the 10% per-year mark.
- Increased regulatory pressure is also playing an ever-greater role. In June of 2011, the SEC mandated that buyout firms comply with the 2010 Dodd-Frank Act, a change that gave the regulator legal recourse to audit buyout firms’ financials at a much higher level of detail. The percentage of fund managers who said that their firm had been subjected to exams or audits over the past two years rose to 47% in 2015, up from 28% in 2013.
- The controversial issue of carried interest (by many considered to be a quasi-tax loophole) also appears to be under scrutiny. In June 2015 the “Carried Interest Fairness Act of 2015” bill was introduced aiming to amend the situation. Estimates put the increased tax bill at as much as $180 billion over ten years.
- Investor scrutiny and competition. Partly as a result of the above, many limited partners are starting to demand more favorable fee structures and in some cases even competing directly against PE funds in the acquisition of target companies.
- Funds are having to innovate and find ways of remaining competitive/relevant. Many funds have begun changing their operating models and experimenting with new strategies. These changes include:
- A move to non-traditional buyout sectors such as technology and new areas in healthcare. Historically, the bulk of deals in the buyout space are placed in the consumer goods and finance industries.
- A greater emphasis on “buy-and-build” strategies of using portfolio companies as springboards through which to acquire similar or adjacent companies in order to build bigger portfolio assets. Such acquisitions give PE firms the freedom to direct existing portfolio investments in new directions and allows them to realize strategic synergies similar to corporate investors.
- An increased focus on portfolio management and generating operational efficiency in their investments. The days of relying mainly on financial engineering and leverage to generate value have passed.
- A greater use of technology and outsourcing to drive efficiency at the GP level. In terms of outsourcing certain operating functions, 88%, 82%, and 71% of investors agree that tax compliance, treasury, and fund accounting, respectively, are areas they feel comfortable moving to third parties
The Private Equity Industry Today
The private equity industry is today one of the largest and most important asset classes on the planet. Its influence on the economies of countries around the world is pronounced. Looking at employment for instance, in the US, if one aggregates the top five private equity groups, they would collectively be the second largest employer after Walmart, according to a recent study. And similar conclusions can be made when doing the same in Europe or Asia-Pacific (Chart 1).
But what exactly is private equity? How can an industry so poorly understood be among America’s top employers? How does it operate and who are the key players? How has it evolved over the years? Why has it been such a hot topic lately? This article aims to answer all the above questions and explore the evolution of this industry, with an assessment of the challenges it faces and a look at how different players in the industry are tackling them with new strategies and by finding less competed investment niches.
Definition and Overview
In and of itself, the definition of private equity (PE) is not a straightforward one. One could argue that, more than an asset class, it’s a style of investing in which investors, with the help of a manager, purchase companies with the aim of finding operational efficiencies over fairly long holding periods (generally 5-7 years). For those who do consider it as an asset type, Private equity is a subclass within the broader private capital sector (Table 1).
Private capital is a broad label applied to any private investment fund or vehicle that invests in the equity or debt securities of companies, real estate, and other real assets. The shape and form of these vehicles can vary substantially, but at their core, what binds them all together is that they are privately held, as opposed to publicly traded.

Among the different classes within private capital, one of the biggest is buyout private equity (Chart 2). And this classification is what we refer to as private equity, and the focus of this article. Having narrowed the playing field, we can now proceed to outline the key characteristics of this asset class—or style of investment—and the characteristics that define it.

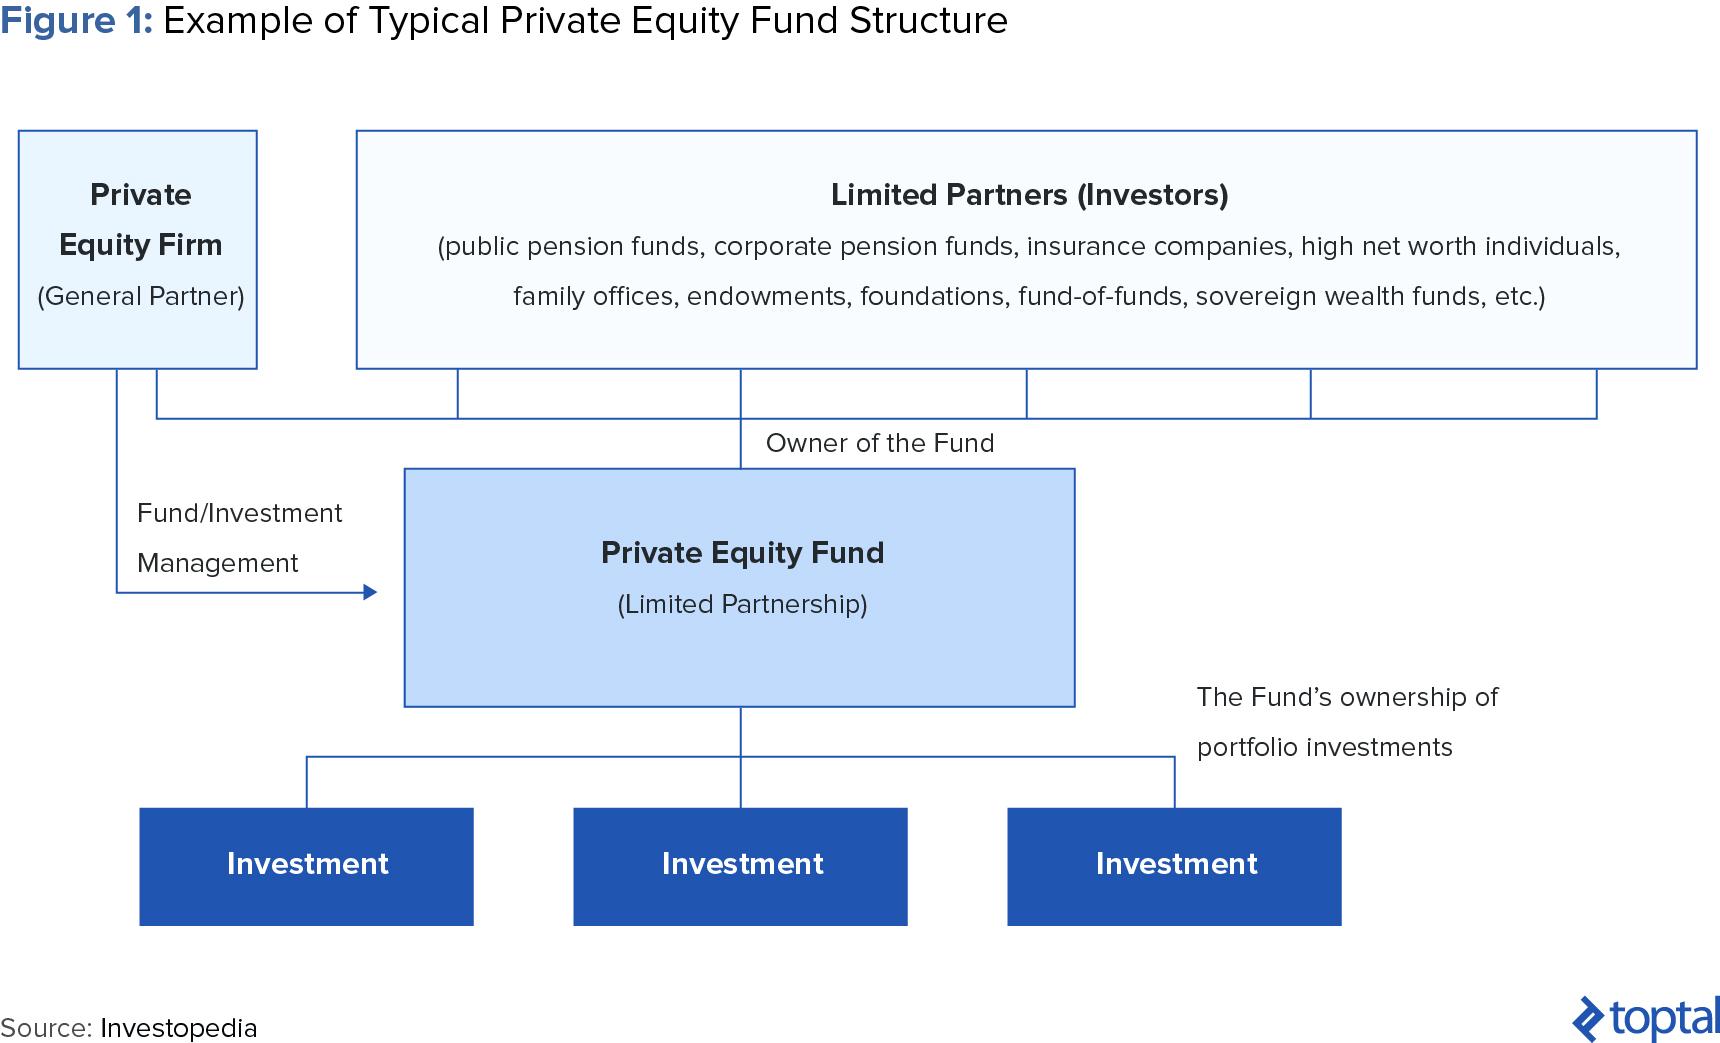
Buyout private equity consists of creating funds as limited partnerships formed for the specific purpose of investing money. Such funds traditionally have an investment period of 5-7 years. The manager of the fund, often referred to as the general partner (GP), is a firm that structures the partnership and is responsible for managing the operations of the fund. The GP raises the money from investors (referred to as the limited partners), and takes on the task of finding/sourcing investment opportunities, analyzing them, and presenting them to the investment committee (often made up principally of the LPs) for approval.
Limited partners (LPs) have limited liability and usually have priority over GPs upon liquidation of the partnership. Typically, institutional investors such as insurance companies, pension funds, and university endowments are among the largest LPs. Other important investors are high net worth individuals and funds of funds.
The purpose of buyout private equity is to buy equity stakes in companies in a range of industries (usually a majority stake) and to then find operational efficiencies and grow the businesses to later sell these and realize a profit.
Such acquisitions generally involve some kind of leverage, be it from banks, private investors or other forms of debt such as mezzanine debt. Leverage as a cheaper alternative to equity for financing deals helps private equity funds to boost the returns of investments made. Simply put, equity participates in the upside, while debt doesn’t. Consequently, the more debt you use, the more upside accrues to the PE fund as opposed to the debt provider (generally the banks). The use of large amounts of debt in the acquisition of companies has led to the term leveraged buyout, or LBO. LBOs have become synonymous with the private equity industry (although they are not a requirement) and are the main focus of this study.
Compensation and Fee Structure
Private equity firms are compensated by working with the 2 and 20 fee structure (or 2/20 model). The 2 represents the 2% annual management fee on capital deployed that is used to pay salaries and cover overhead—to “keep the lights on,” if you will. The 20 represents the 20% carry (or put another way, the commission) charged over a certain return threshold that the private equity firm gets to keep.
Typically, private equity funds have hurdle rates of around 8%, although this varies from fund to fund and from region to region. Once the debt portion of the fund has been honored, the distribution of funds for the different stakeholders begins.
Below the hurdle rate, only limited partners will have the right to any returns. But once the hurdle rate is breached, general partners are entitled to a 20% share on anything above the hurdle and, in most cases, on everything that has been generated below the hurdle. That is, after the hurdle is breached, funds enter the so called “catch-up” region when subsequent, post-hurdle distributions are accrued to the general partners until the carried interest equals 20% of the entire limited partners’ returns. Finally, if there are any distributions left, the profit sharing phase begins where limited partners are entitled to an 80% share of profits and the general partner is is entitled to 20% of profits.

The North American private equity market is by far the largest in terms of value. According to Bloomberg, over 57% of global deal value in 2015, or roughly $459 billion, was concentrated in North America (Chart 4). The second most active area in the world in terms of value of deals was Europe, with China increasingly becoming a PE superpower. According to Bloomberg, China’s dominance as a PE superpower is only expected to increase in the coming years.
In terms of number of funds, the picture is largely unchanged. The U.S. is home to the greatest number of top private equity funds, followed by Western Europe and then China (Chart 5). A quick scan of the largest funds in the world reveals some familiar names. The Carlyle Group is the largest private equity manager in the world and has raised a total of $66 billion in the last 10 years. It is followed by the Blackstone Group with $62.2 billion and KKR with $62.2 billion. Goldman Sachs, TPG, Warburg Pincus, Advent International, Bain Capital and Apollo are all also important funds in the space and by now relatively well-known household names in the financial industry.

History and Context
Given the ambiguity of the definition of private equity, it is difficult to trace a precise historical path for the industry. After all, acquisitions of businesses and minority investments in companies has been happening for hundreds of years. However, if we go with our definition above and narrow down the scope using two specific aspects of the model, namely a) the LP/GP structure, and b) the use of leverage in buyouts, one could argue that the birth of the modern private equity industry can be traced back to the 1955, when McLean Industries, Inc. purchased the stock of Pan Atlantic Steamship Corporation and Gulf Florida Terminal Company, Inc. from Waterman Steamship Corporation. This is considered by many to have been the first example of a leveraged buyout, where the total acquisition consideration was financed mainly through the use of debt.
Nevertheless, the first true private equity fund (at least going by the definition we outlined above), can probably be credited to have been KKR, which was formed in 1976. Founded by Jerome Kohlberg, Henry Kravis, and George Roberts, KKR raised its first institutional fund in 1978 following the revision of the Employee Retirement Income Security Act which paved the way for greater investments into these types of financial vehicles. That same year KKR completed the largest take-private of all time with the acquisition of the publicly traded Houdaille Industries for $380 million.
Since then, the private equity industry has continued to grow steadily in both size and importance. As with many other markets, the PE industry’s rise can be traced through a few boom/bust cycles. The first one was during the 1980s when several new PE funds sprung up to take advantage of the increasing investor interest in this new type of investment vehicle. Strongly supporting the growth of this phase was the ascent of junk bonds (also known as High Yield bonds), which helped finance many of the LBOs of the period. This was the period in which the now (in)famous acquisition of RJR Nabisco took place, a deal later immortalized in the book Barbarians at the Gate.
With the advent of the Savings & Loan Crisis and the collapse of the junk bond market, the PE industry suffered, and the first boom/bust cycle came to an end. However, by the mid-1990s, the industry had already recovered, and the remaining part of the decade saw many headline-grabbing LBOs including Duane Reade (1997), J. Crew (1997), Domino’s Pizza (1998), and Petco (2000). Nevertheless, with the burst of the tech bubble and the associated stock market crash, the industry once again faced retrenchment. In particular, many PE funds had invested heavily in the telecommunications sector which of course was hard hit from the crash. The high-yield bond markets also froze up, making LBO activity all the more difficult.
As the dust from the Dotcom crash settled, the PE industry in the early 2000s embarked on the latest, and perhaps most spectacular, boom period for the industry. Fundraising grew at incredible rates, reaching all time highs by 2006/2007 (Chart 6). Fueled by a low interest rate environment which fostered favorable debt market conditions, as well as increasing regulation of public companies (making take-private’s more attractive), the PE industry entered a period of mega-buyouts, in which thirteen of the fifteen largest LBOs of all time were completed. The PE industry also witnessed strong growth around the world, with the asset class in Europe and Asia seeing strong traction.
Also notable during this period was the launch of several publicly traded PE funds, including KKR, which raised a $5 billion permanent investment vehicle, and Blackstone, which actually became the first publicly traded private equity firm (meaning that the management company is publicly traded). This period also saw an institutionalization and formalization of the secondary market for private equity as an asset class. More than ever before, LPs bought and sold their stakes in PE funds, essentially giving birth to a whole sub-sector of the market that previously was fairly niche.
In many ways, the 2000s, up until the advent of the 2008 Global Financial Crisis, marked the golden age for the sector as it reached record heights, and levels of depth and sophistication never seen before.
Private Equity Returns as an Asset Class
One of the reasons private equity has done so well historically is down to returns. No matter the time-horizon one takes into account, short or long, private equity has outperformed public markets in all major regions. This statement is true for the U.S., Europe and Asia-Pacific. Cambridge Associates’ U.S. Private Equity Index, for instance, returned 13.4% annually (net of fees) between 1986 and 2015 with a standard deviation of 9.4%, while the Russell 3000 Index (a well-known stock market index) returned 9.9% with a 16.7% standard deviation over the same period.
But higher returns come at the expense of liquidity: Private equity, as discussed, contemplates much longer investment horizons that are comfortable for patient capital owners who can afford to lock up large amounts of money for up to ten years in some cases. It’s no surprise pension funds and university endowments, which have very long term horizons, have been a traditional favorite of such investment vehicles. Public markets, on the other hand, offer almost immediate liquidity, but are subject to many more fluctuations in the day-to-day.

Private Equity Trends and Threats
Despite the tremendous growth witnessed by the industry over the last three decades, the latest trends we are seeing are classic signs that the space is entering a phase of maturity. In particular, we see a series of what we refer to as “top-down” threats, as well as several “bottom-up” threats, all of which point to the fact that the industry’s growth trajectory is likely to flatten and perhaps even revert, and that fundamental changes are likely to take place over the coming years. We run through these in turn.
Top-Down Threats
Excessive Competition
At no point in history has the private equity space been as competitive as it is today. Between the years 2000 and 2016 the number of private equity firms globally has tripled and the amount of assets under management has grown from almost $600 billion in 2000 to almost $2,500 billion (Chart 8).
The huge amounts of capital that have flowed into the private equity industry also mean that accumulated “dry powder” is at record highs. Dry powder, the industry’s term for uninvested capital, grew to more than $500 billion by March 2017 (Chart 9).

LPs are not fans of dry powder. Idle capital means GPs charge fees over assets under management without having those funds working towards generating returns. As will be discussed later on, this has pushed LPs to seek different investment models, such as direct investments or co-investments.
Increased Competition from Corporates
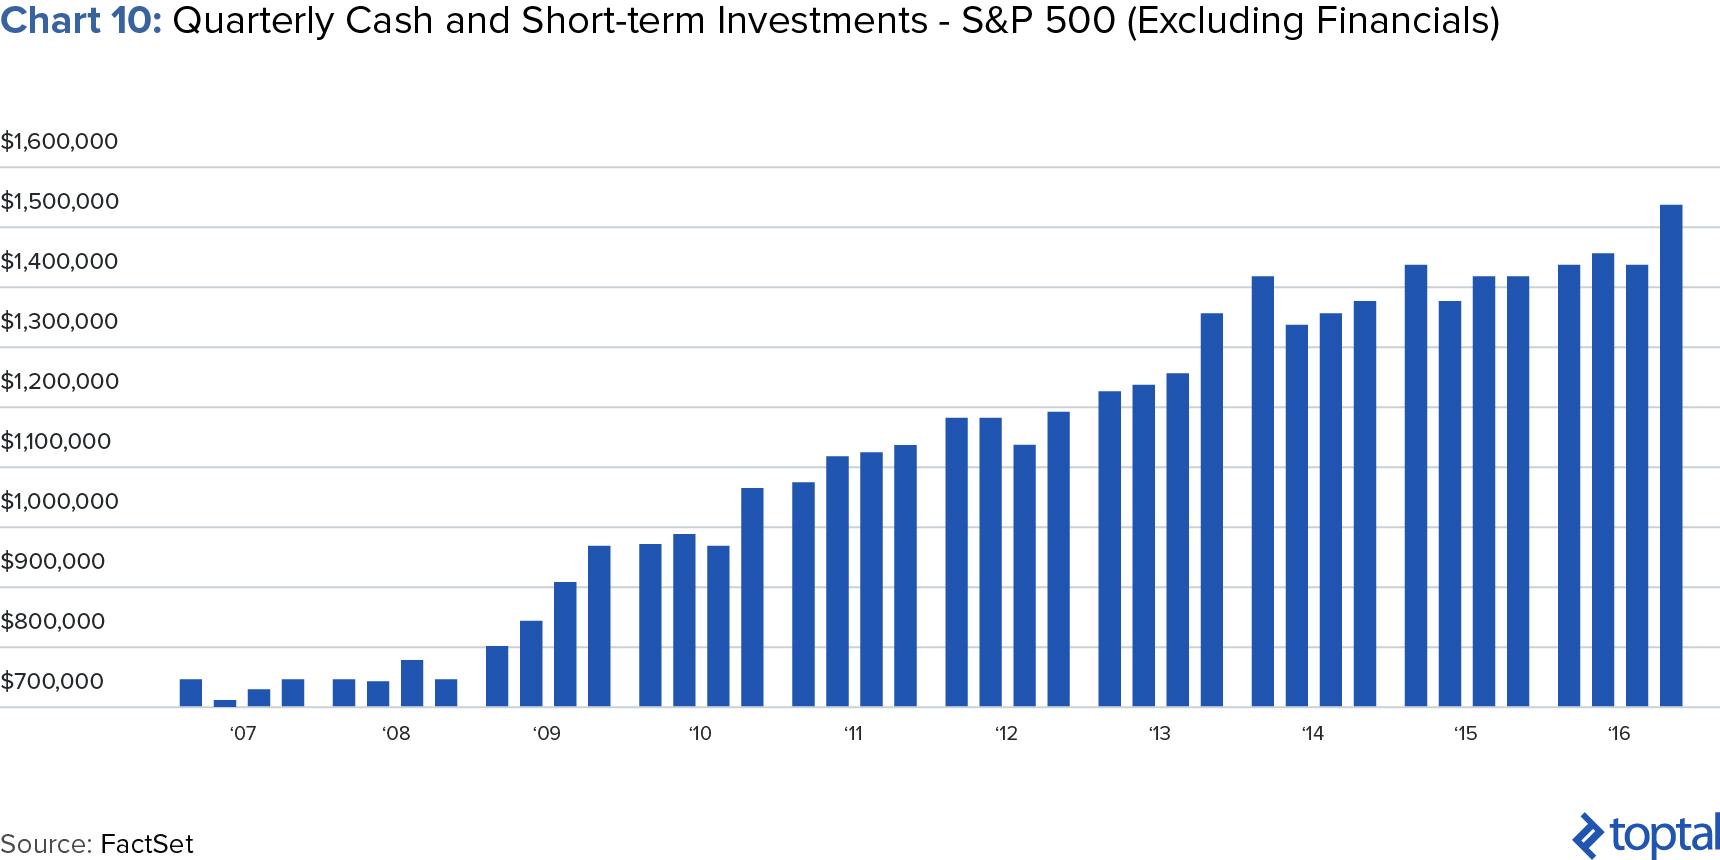
Probably the greatest threat faced by buyout firms today is the one posed by corporations who over the past few years have accumulated vast amounts of cash (Chart 10). Corporates are therefore often competing against PE funds in the acquisition of target assets.
An important advantage that corporations have over PE funds is that a) they can extract strategic synergies from their acquisitions, making the value of these targets higher, and b) they can do so over longer investment horizons. While private equity firms are looking for exits in the 5-10 year range, corporations in most cases simply hold their positions, allowing them to absorb higher valuation multiples on their acquisition targets.
The result is that private equity funds are now losing out even more in mergers and acquisitions to non-financial companies than in the previous years. In 2016, buyout firms’ global share of all M&A deals dropped to 4.2%, the lowest level since the 2009 recession minimums. This was down from 5.4% as recently as 2014 and an all-time high of 7.9% in 2006 (Chart 11). The same trend is evident in Europe and in the U.S., private equity’s two biggest markets.

The most recent example of private equity groups being outbid by corporations is Verizon’s Yahoo $4.5 billion acquisition. TPG, Bain Capital, and Vista Equity, three of the largest PE groups in the world, were the other bidders on this deal. But even in cases where private equity firms end up outbidding corporate investors, it is at the expense of much higher valuations (and thus much lower returns for their investors). In a recent example, Polycom, the video conferencing technology manufacturer, was the object of a bidding war between Mitel Networks (a corporate) on the one hand, and Siris Capital, a tech focused private equity firm. This bidding war between both groups resulted in Siris Capital’s initial offer being raised more than 20%, resulting in a $2.0 billion deal.
Result: PE Funds Are Finding it Harder and Harder to Find Good Deals
Not surprisingly, the excess of demand for deals has pushed valuations to highs only seen in the pre-recession years: a median purchase price of 9.2 times EBITDA globally, and 10.9 times EBITDA in the U.S., the highest figure since 2007.

The resulting situation is therefore a perfect storm for PE funds: record-high valuations sustained by record levels of competition amongst PE firms and corporates. This therefore suggests that valuations are only likely to keep growing, PE firms will struggle to find attractive deals, and returns will generally suffer due to the unfavorable market conditions.
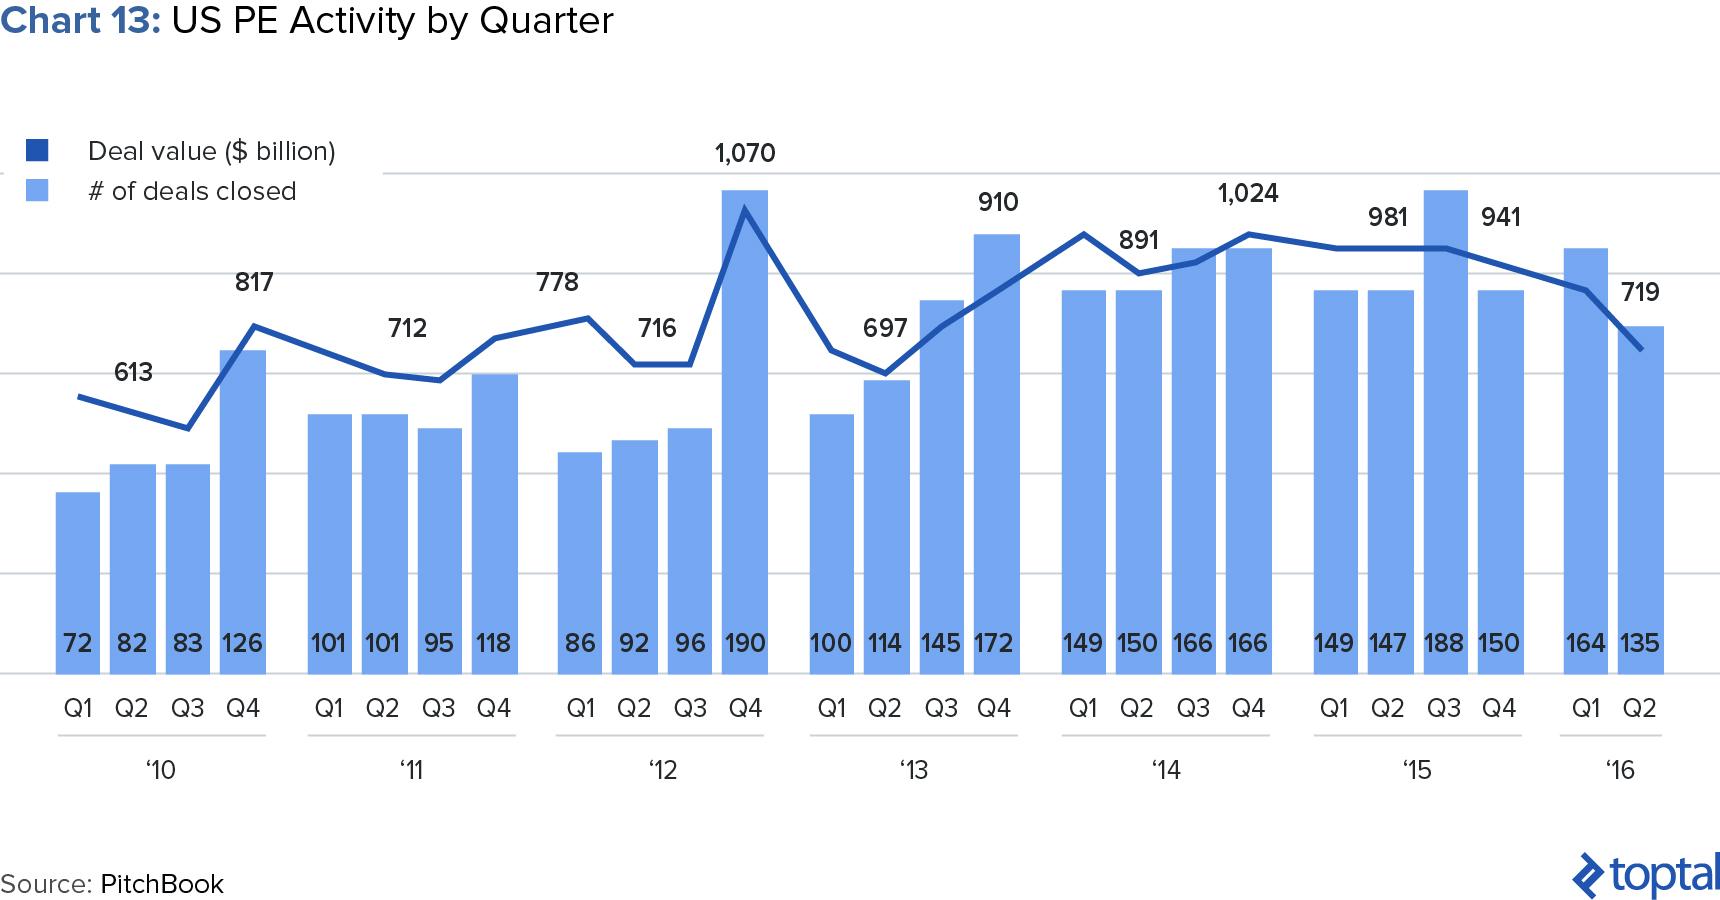
And in fact, we are already seeing the effects of all this. According to PitchBook, US buyout activity has been cooling over the past three-and-a-half years, and in Q2 2016 reached 2013 levels (Chart 13).
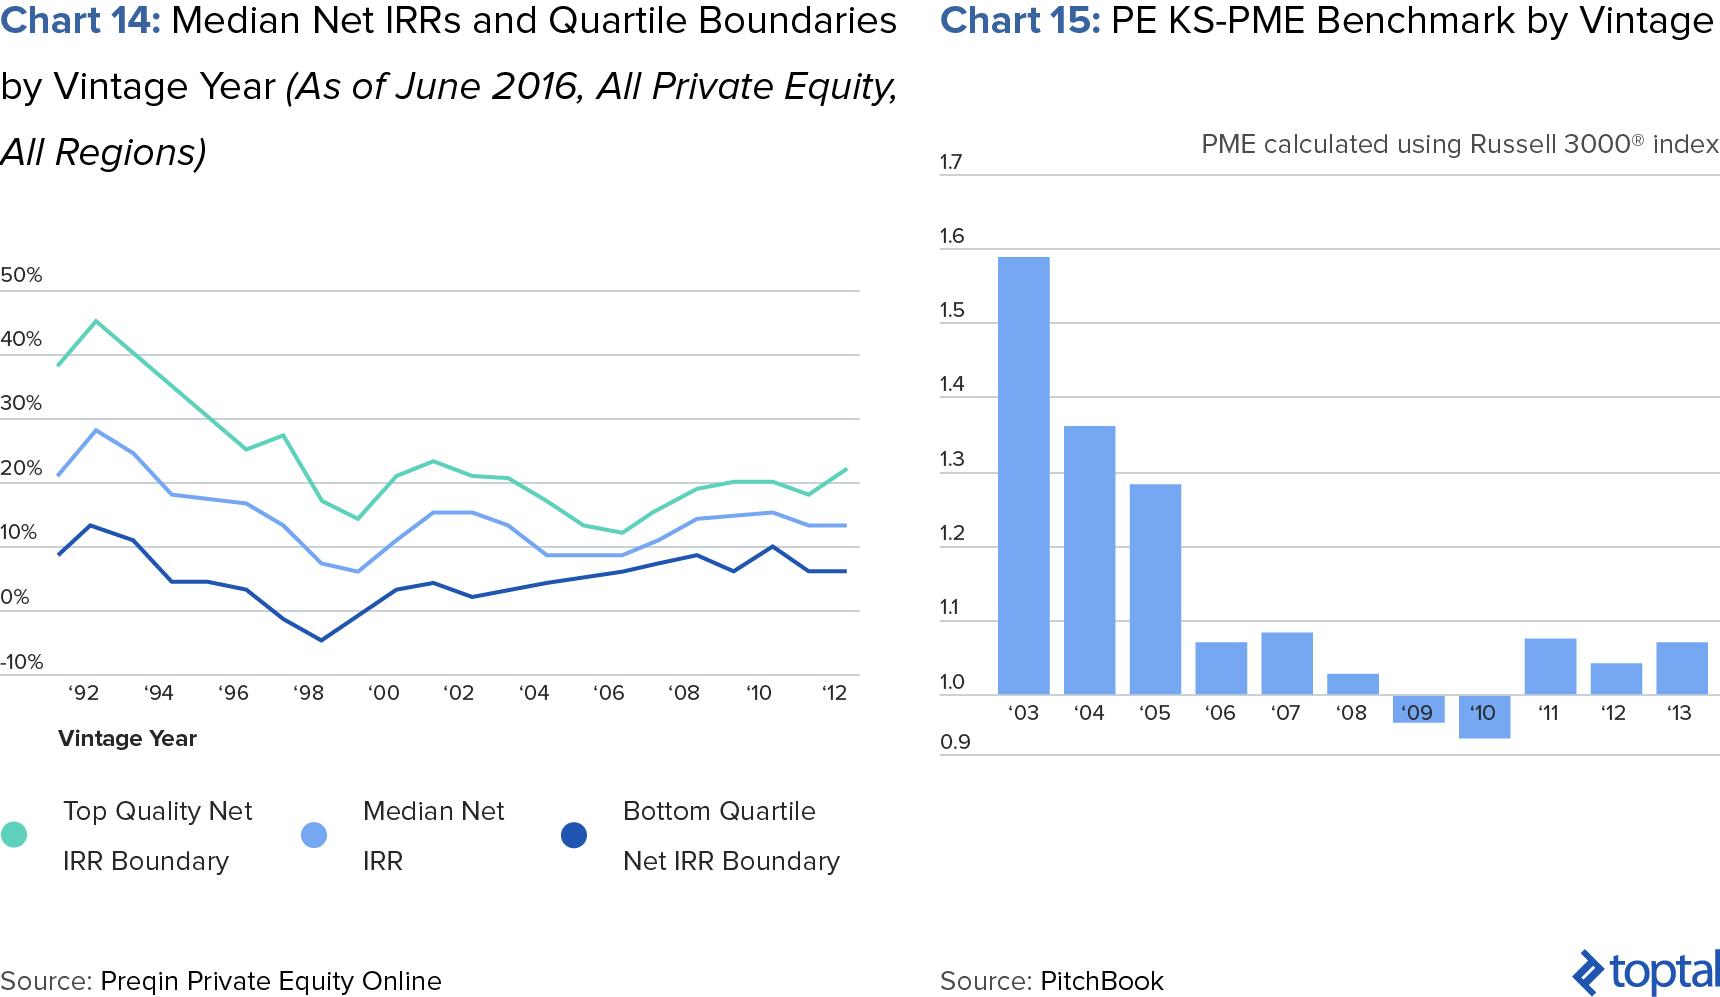
Returns for the asset class have also already begun to suffer. As can be seen in Chart 14 below, median net internal rates of returns (IRRs) have been largely stagnant since the beginning of the century at the 10% per year mark. In some ways, returns followed the general market downward, but as can be seen in chart 15, even as the public markets recovered, PE returns have not improved to any significant degree.
Bottom-Up Threats
Increased Regulation
Further evidence that private equity is a maturing industry is the increased amount of regulation the sector has experienced in recent years. In June 2011, the SEC mandated that buyout firms comply with the 2010 Dodd-Frank Act, a change that gave the regulator legal recourse to audit buyout firms’ financials at a much higher level of detail. And as is often the case, the implementation of new regulations leads to the discovery of non-compliant industry players.
In May 2014, the head of the SEC’s Office of Compliance Inspections and Examination, Andrew Bowden, said he discovered “illegal fees or severe compliance shortfalls” in more than half of the 112 buyout firms investigated. On May 6th, 2014 the regulator later published a report titled Spreading Sunshine in Private Equity, in which it accused GPs of using “broad, imprecise language” that resulted in opacity “when transparency is most needed.” The report also mentioned that of the firms the SEC had inspected, “violations of law or material weaknesses in controls [have been found] over 50% of the time.” Another observation pointed out that limited partners (LPs) often struggled to “adequately monitor” both their investments and the activities of their GPs. Bowden highlights that while LPs conduct substantial due diligence before investing, investor oversight is much more lax after closing. Potential problems in portfolio companies are then concealed or diluted by GPs utilizing “broadly worded disclosures and poor transparency.”
Another area of controversy for regulators was the tax rate fund managers had to pay on profits for investments, the “carried interest” as it is referred to in the private equity industry. In the U.S., fund managers’ management fees are taxed at income tax rates. In most cases, fees on these earnings to managers landed in the highest tier, or almost at 40%. However carried interest earnings are considered long-term capital gains. In an effort to promote investment, back in the 1930s, the U.S. government created a provision in the tax code allowing a much lower tax rate for long-term capital gains, around 20%. This has been seen by many as a loophole in the tax system as fund managers would pay an unfairly small tax rate on much of their earnings which, in reality, should be taxed as personal income.
In June 2015 the “Carried Interest Fairness Act of 2015” bill was introduced aiming to close this loophole. The numbers resulting from this bill are not trivial. In a New York Times article, professor Victor Fleischer estimates the US government could be raising as much as $180 billion over ten years.
Furthermore, In January 2016, the Institutional Limited Partners Association (ILPA) issued the Fee Reporting Template. This guideline is designed to show investors, in a transparent manner, how money is collected by GPs, and how costs are accounted for and offset. Albeit optional for most, the adoption of the template by giant fund managers of the size of TPG and other important GPs has set a road to standardization for other industry players. With competition in the sector at all time highs, investors will seek those administrators that provide good returns but also more transparency throughout the investment cycle.
In a 2016 survey with managers of 103 funds, Ernst & Young found that “the percentage of fund managers who said that their firm had been subjected to exams or audits over the past two years rose to 47% in 2015, up from […] 28% in 2013” (Chart 16). It is therefore not a surprise that in the same survey, 64% of managers mentioned that regulation was one of the key topics making day to day operations more complex (Chart 17). With more countries following the leading examples of more mature markets, regulation is a topic that will continue to add complexity to the day to day operation of LBO funds.